Azzalini's Skew-Normal QuickTime movie (800K)
This animation shows Azzalini's ![]() varies between 0 (a standard Normal pdf) and 1 (a half-Normal pdf). Computational details are discussed on p.225 of Mathematical Statistics with Mathematica. For detail on skew densities, please see The Skew-Normal Web Site.
varies between 0 (a standard Normal pdf) and 1 (a half-Normal pdf). Computational details are discussed on p.225 of Mathematical Statistics with Mathematica. For detail on skew densities, please see The Skew-Normal Web Site.
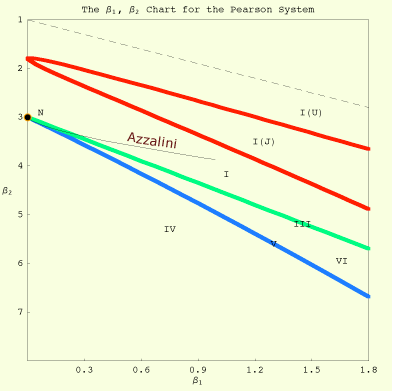
The following diagram plots the Azzalini skew-Normal pdf on a Pearson diagram. The diagram itself is derived as an exercise on p.185 of Mathematical Statistics with Mathematica.
